UML
Content:
- Introduction
- What is UML?
- Why UML?
- General approach
- Diagrams
- Use case diagram
- Class diagram
- Deployment diagram
- Activity diagram
- Sequence diagram
Introduction:
The purpose of this article is to provide a very basic intro to UML. The perspective
will be practical.
If you want to learn complete UML then this article is not for you.
If you need to genereate code from UML then this article is not for you.
If you are required to provide some specific UML artifacts per company standards
then this article is not for you.
If you are looking for a way to provide some useful documentation for some code
then this article may be for you.
What is UML?
UML was created in 1997 by James Rumbaugh, Grady Booch and Ivar Jacobson - also
known as "the three amigos". It is managed by OMG (Object Management Group)
It has additionally been standardized as ISO 19501 since 2000.
Versions:
| Version |
Year |
| 1.1 |
1997 |
| 1.3 |
2000 |
| 1.4 |
2000 |
| 1.5 |
2003 |
| 2.0 |
2005 |
| 2.1.1 and 2.1.2 |
2007 |
| 2.2 |
2009 |
| 2.3 |
2010 |
| 2.4.1 |
2011 |
| 2.5 |
2012/2015 |
| 2.5.1 |
2017 |
Why UML?
Diagrams can be much better than code to provide an overview.
UML diagrams are not inherently better than other types of diagrams, but UML
is the standard for diagrams.
By using UML diagrams instead of another diagram type one maximize the number of
people that can read ones diagrams.
General approach:
For UML diagrams to provide real value then they need to document some aspect
of the code in a way that help developers and in a way such that it is an order
of magnitude faster to read the diagrams than reading the code.
If it takes as much time to read and understand a diagram as it would take to
read and understand the code, then the diagram does not provide value.
So the best diagram is not the diagram that has the most details - the best diagram
is the diagram that has the least details but still provide the overview it is intended
to do.
So another case of "less is more".
Diagrams:
Originally UML had:
- Use case diagram
- Package diagram
- Class diagram
- Deployment diagram
- Activity diagram
- Sequence diagram
- State diagram
- Collaboration diagram / Communication diagram
Later versions added:
- Component diagram
- Composite structure diagram
- Object diagram
- Profile diagram
- Interaction overview diagram
- Timing diagram
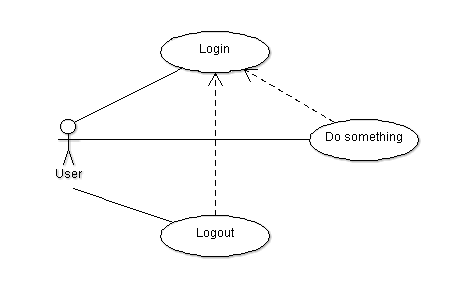
Use case diagram:
Use case diagrams are typical created by BA's and just read by developers, so we will
go quickly over them.
Basically a use case diagram just show relations actor - use case and use case - use case.
Actors are represented by stick figures. Use cases are represented by ellipses with
titles. Relations are shown with lines.
Example:
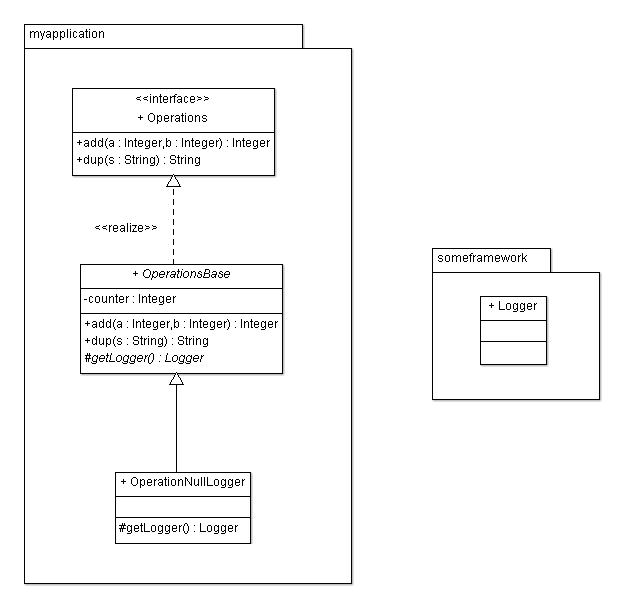
Class diagram:
Class diagrams are one of the most common UML diagrams.
A class is represented by a rectangle partioned in 3 horizintal stripes. First stripe contains
the class name. Second stripe contains the attributes (fields) of the class. Third stripe contains
the methods of the class.
Attributes are specified with type. Methods are specified with arguments and their type plus
return type.
A prefix specify visibility (+ means public, - means private, # means protected).
Interfaces just have two horizontal stripes with interface name and methods.
Classes inheriting from classes is indicated with a full line arrow.
Classes implementing interfaces is indicated with a dashed line arrow.
Classes and interfaces can be put inside packages.
Example:
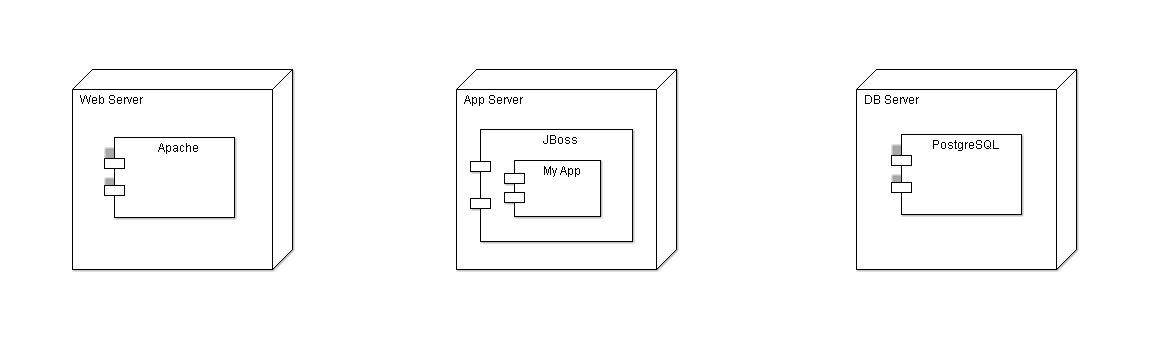
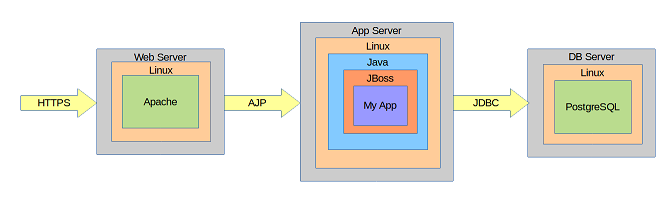
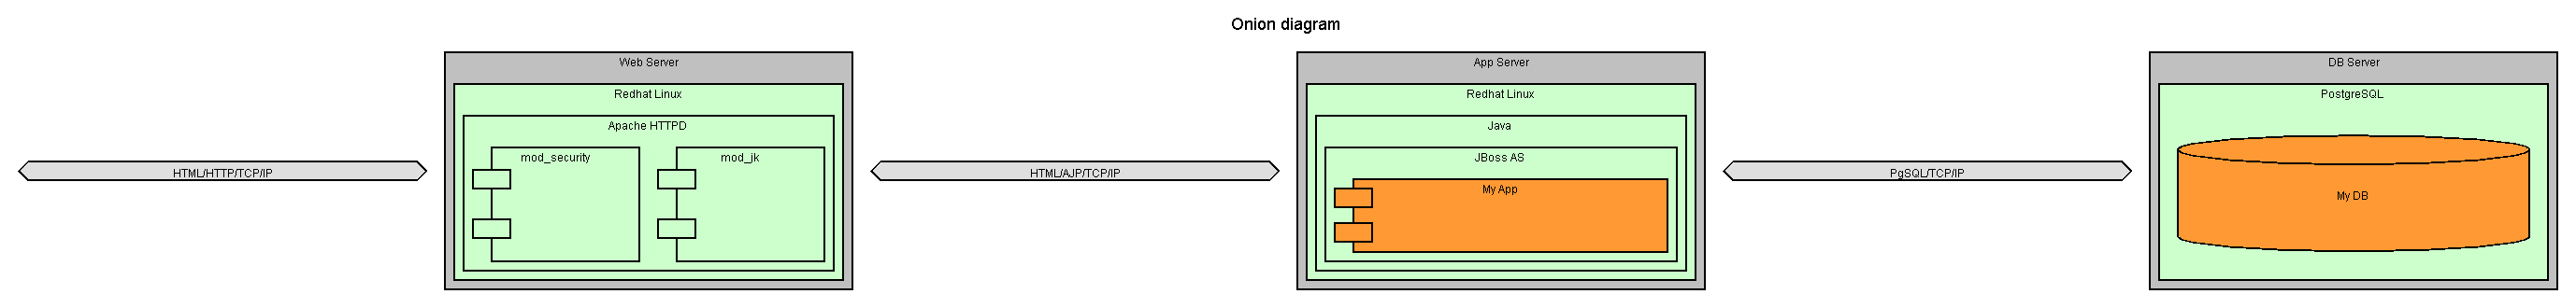
Deployment diagram:
A deployment diagram show how software components get deployed on systems.
Components are represented by a rectangle with two small rectangles on the left side.
Systems are represented by perspective boxes.
Example:
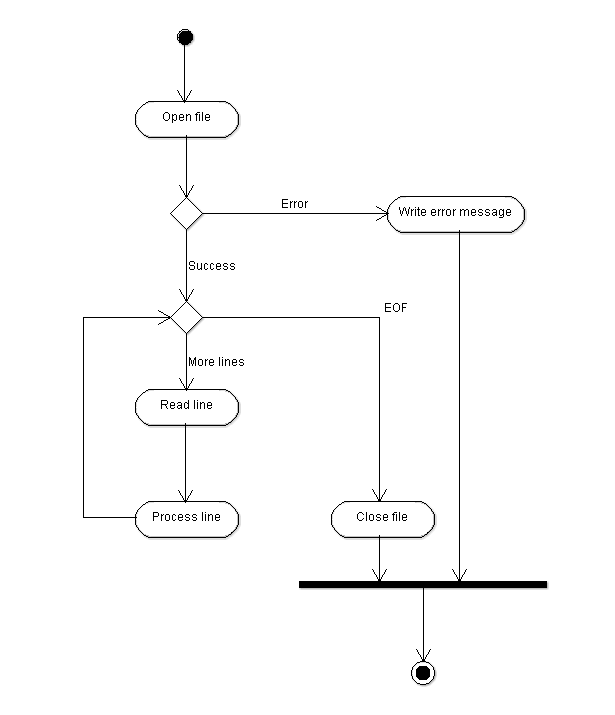
Activity diagram:
An activity diagram shows the logic or algorithm in the code - similar to old flow charts.
Activities are represented by rounded boxes. A choice is represented by rombes. Possible
flows are represented by arrows.
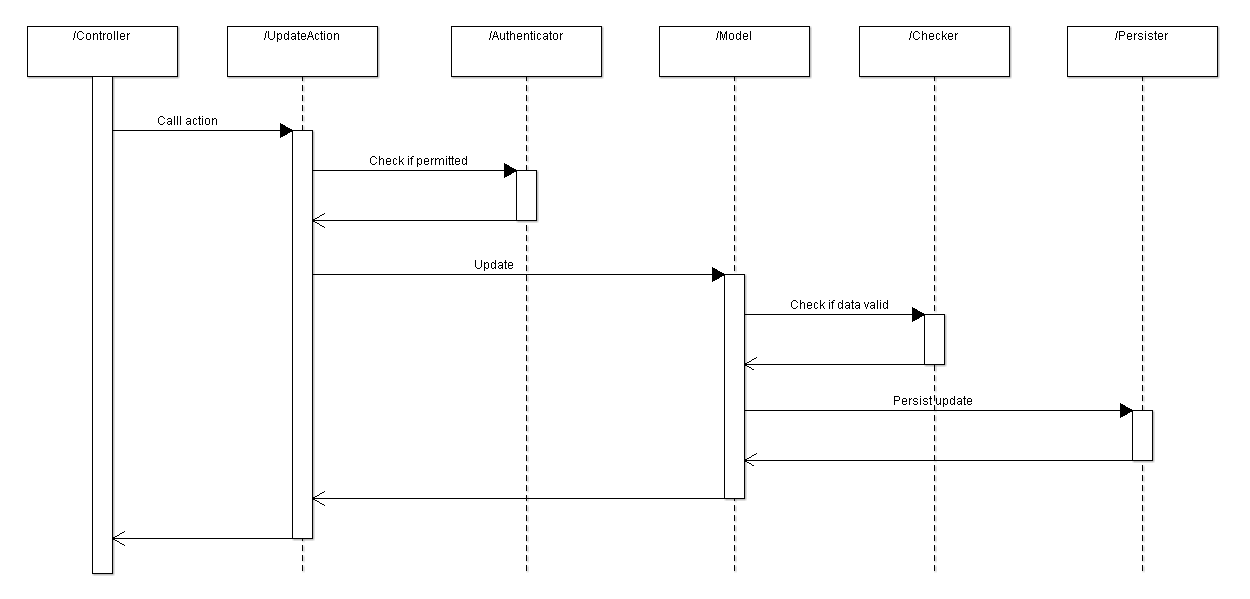
Sequence diagram:
A sequence diagram show how pieces interact.
Each piece is showed as a vertical symbol. Arows show calls and returns.
Example:
Article history:
| Version |
Date |
Description |
| 1.0 |
December 19th 2021 |
Initial version |
Other articles:
See list of all articles here
Comments:
Please send comments to Arne Vajhøj
Class diagrams are definitely useful as they document the code.
But my recommendation is to use class diagrams that just outline the most important aspect of the classes instead of class diagrams that are complete.
As an example then instead of:
I think this:
provides just as much useful information in a more readable form.